 |
|---|
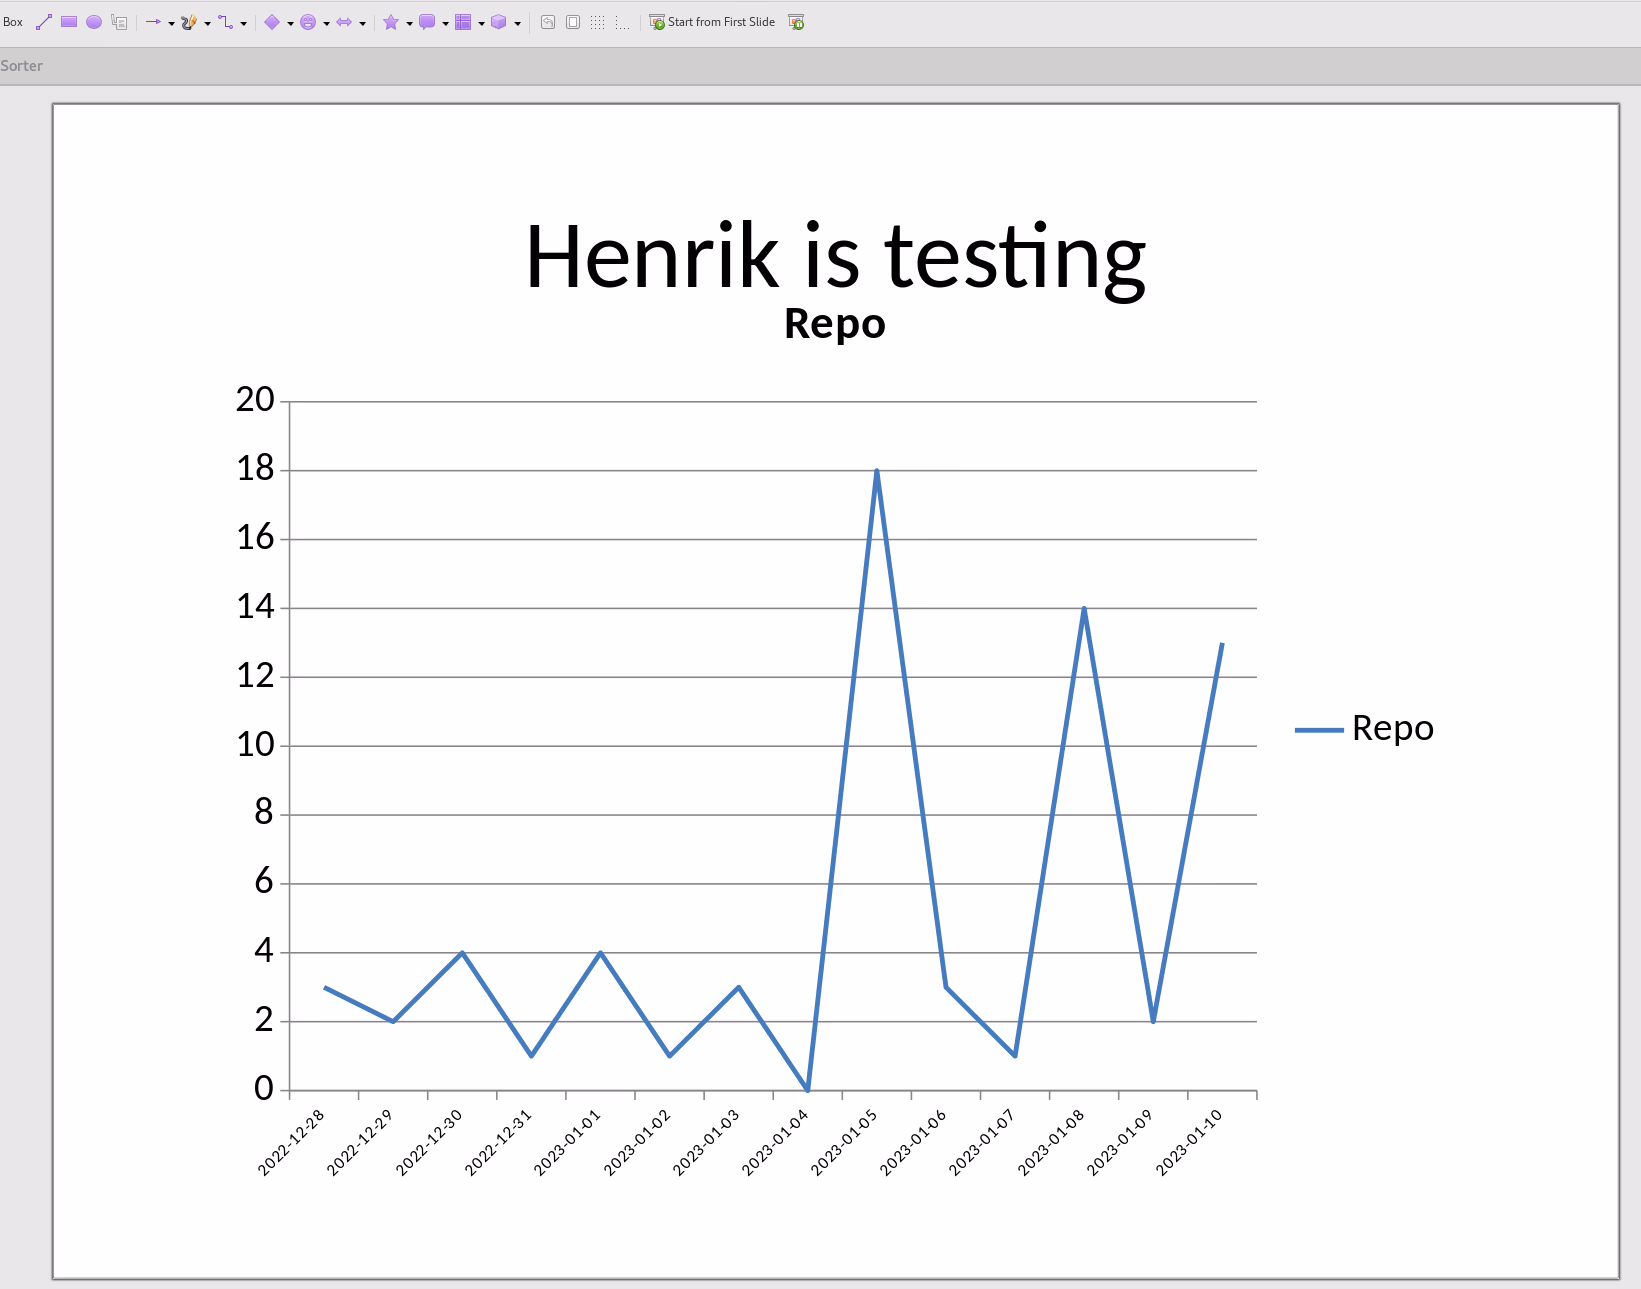
| Generated PowerPoint slide with Db2 data |
How did you spend the holidays? I had some days off and then used the last day of vacation for some fun programming. Last year, I wanted to test the python-pptx package, but couldn’t find time. So I used my “fun day” to generate / code up some PowerPoint slides. To make it more interesting, I added some charts from data retrieved from Db2 in my IBM Cloud account. Here is a quick recipe.
Ingredients
Use the following Python packages:
- python-pptx, a package to create Open XML PowerPoint documents in Python
- SQLAlchemy, the SQL toolkit for Python.
- ibm_db_sa, the Db2 driver for SQLAlchemy. See my post How to connect from Python to Db2 for details.
Preparation
Install the required Python packages, copy the sample code for creating a line chart. Implement a small function to create the Db2 engine in SQLAlchemy, connect to a Db2 database, execute a SELECT statement and retrieve the data. Call that function and feed the data to the line chart.
Tasting
Some fun to begin the year, some new experience, and maybe a new talk at one of the upcoming IDUG conferences or DeDUG meetings.
If you have feedback, suggestions, or questions about this post, please reach out to me on Twitter (@data_henrik), Mastodon (@data_henrik@mastodon.social), or LinkedIn.
