 |
|---|
| Weather Graph in Jupyter Notebook |
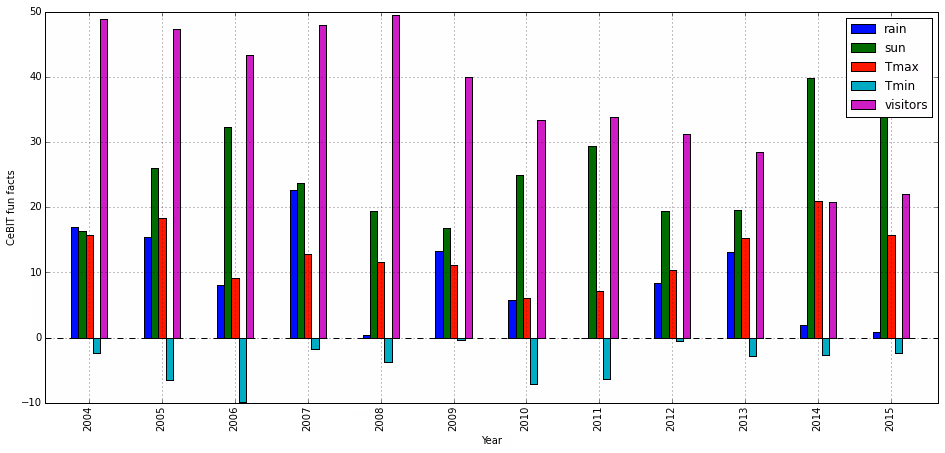
Some time ago I shared with you how I used open data like weather data and CeBIT statistics to have some fun with Jupyter Notebooks. Notebooks are an old, but now - in the age of Cloud Computing - trendy way of collaborative data exploration (see this article for some background reading). Notebooks consist of so-called cells, places to put code, instructions, text and more. Cells can hold Markdown-formatted text, code written in Python, Scala and other languages. It is possible to fetch data from DB2, dashDB and other database systems and process it in the notebook, creating stunning graphics. And with extensions such as RISE (reveal.js IPython Slideshow Extension) those notebooks replace Powerpoint & Co as source for great data-driven presentations. How to use notebooks and DB2 is what I plan to present at the IDUG EMEA 2016 Conference in Brussels later this year.
If you can’t wait until then I recommend to take a look at these recent blog posts on how to get started with Notebooks and data on Bluemix:
- The first blog gives you basics on processing data in so-called data frames and to generate tables and graphs. The data is Open Data and is loaded off the Analytics Exchange on Bluemix. The notebook utilizes the computing power of an Apache Spark cluster.
- The second blog covers how to analyze Twitter data for market trends. The example uses dashDB/DB2 to hold the data. The scripts are written in Python and plug into Sentiment Analysis and Natural Language Processing to understand tweets.
- The last in my list for today is a blog on how to use Apache Spark GraphFrames in notebooks. Airports and flight routes between them are used as base for some computations. It is something every (business) traveler understands.
In case you have trouble programming your notebooks, head over to Stack Overflow and search for “ipython-notebook” or “jupyter-notebook”.
That’s it for today with my notes on notebooks.
